Hi Everyone,
Thank you for such thorough and thoughtful responses! This has given us a lot to discuss and think about, and I will be sure to update this thread as we continue acquiring more reference data in the coming weeks.
I will have to check the Spectralon standard SPD again when I go to run more samples on the Whitmore, as I am not sure about the noise in the <400nm region, but that 5% rule of thumb is good to know going forward.
To answer Christel’s question about %R and measurement instability, yes, the lowest %R spectra appear to be the least stable (Sample 5-1_6, shown below, being the clearest example).
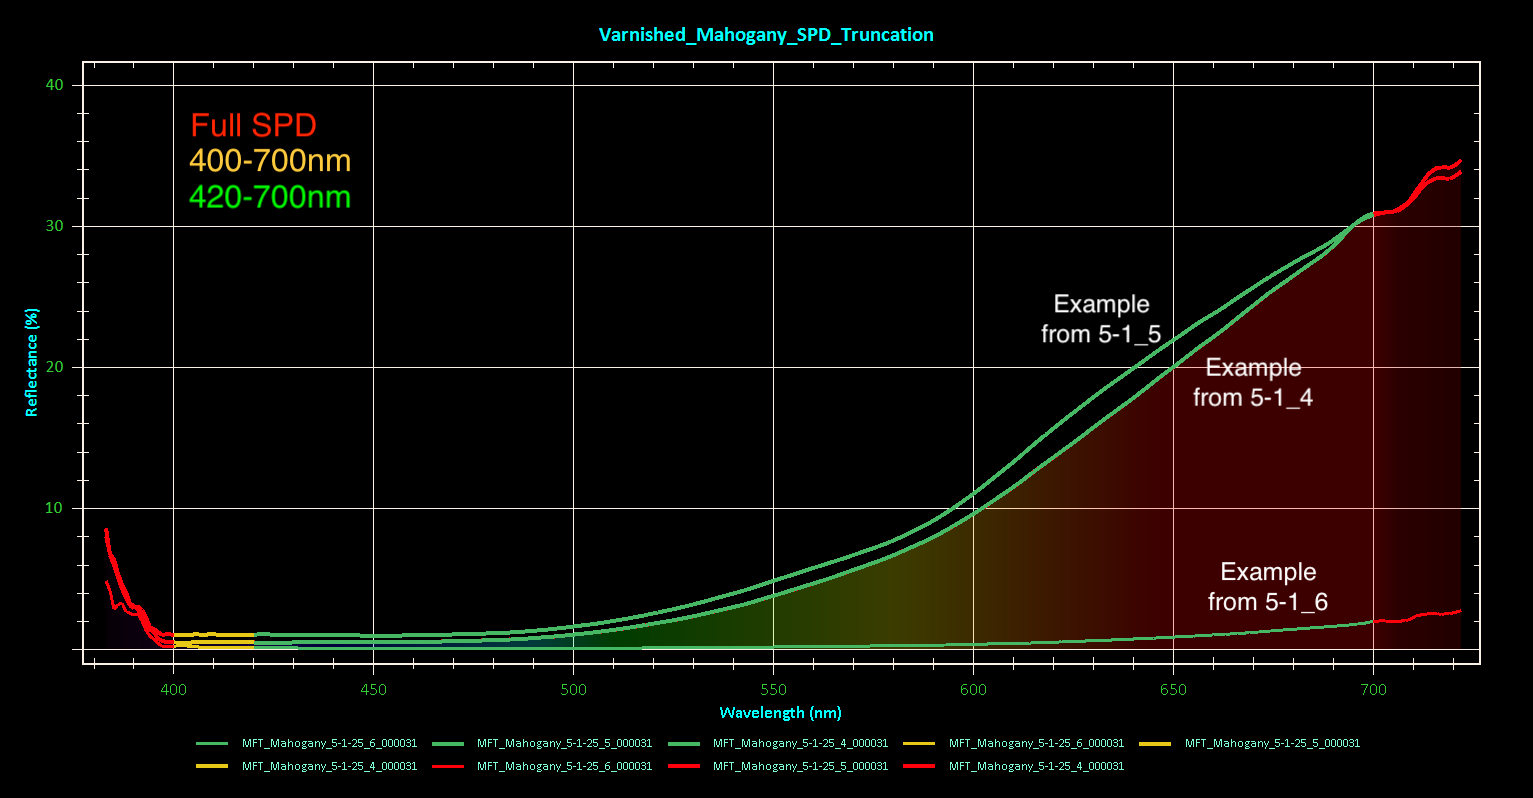
The SPD truncation you all suggested appears to make the greatest difference with the lowest %R varnished sample run (5-1_6), though not as much as what Mike’s DE*00 graph showed. Perhaps that is simply a result of fewer sampling intervals over a shorter runtime on my end.
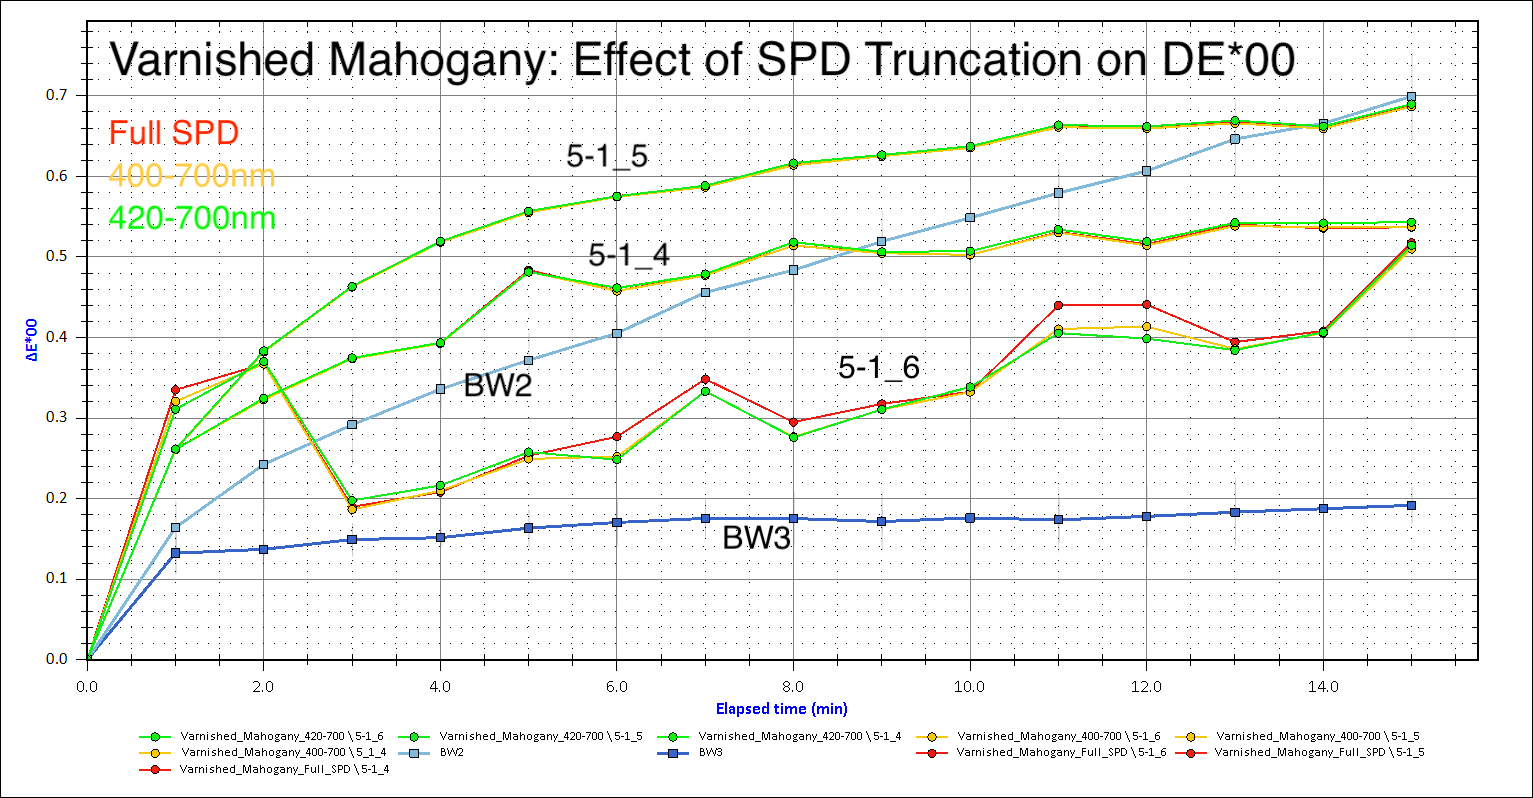
I agree that the case of 5-1_6, it may simply be too low of a %R to be considered usable data. To answer Mike’s question, this kind of scattered, low S/N spectra only occurred on the varnished areas, and happened with some frequency. I generally ended up stopping the run and choosing a different location when I could tell the run was low signal and/or unstable DE*00, thus I don’t have many complete 15min run SPDs to compare to the full, successful runs (varnished or otherwise).
It is good to know that this instability occurring only with the varnished areas is consistent with what Oliver mentioned with MFT of the coated and uncoated manuscripts and the MFT runs through Plexiglas. Similarly, the overall curve of the better, higher %R, varnished veneer runs (i.e 5-1_5) was relatively consistent with the aging trend indicated by the corresponding unvarnished runs (not shown in the graphs here).
In terms of sample location, we do have a dino-lite USB microscope that I agree might be helpful in selecting better (smoother, unpitted) areas of the wood coupons for testing. The varnish layer is relatively thin and uniform (two brush-applied coats), though what appear to be small variations in thickness may have a greater effect at the scale at which the data is being collected.
Within our existing protocol, best focus is achieved visually (switching the spectrophotometer fiber to a secondary input light source and lowering/raising the MFT head such that both beams are centered over each other). This likely results in focusing at the top of the varnish layer, as opposed to the underlying wood surface, which is something that JP mentioned might be an issue. Would focusing by maximizing signal allow for us to focus specifically on the wood surface? How would I go about doing this without prematurely exposing my sample location to the full lamp intensity?
Finally, just to confirm, how (and in what direction) would adjusting the integration time be beneficial for low %R/weak signal samples? I see how increasing the number of scans would help, but I am less clear on integration time.
Thank you all again for your thoughts and suggestions!
Best,
Grace